
good first issue
Repository metrics
- Stars
- (1,197 stars)
- PR merge metrics
- (Avg merge 1d) (14 merged PRs in 30d)
Description
Interactive visualization of results would be a convenient tool for analysis
Makie.jl looks suitable for this https://github.com/JuliaPlots/Makie.jl examples: http://juliaplots.org/MakieReferenceImages/gallery/index.html
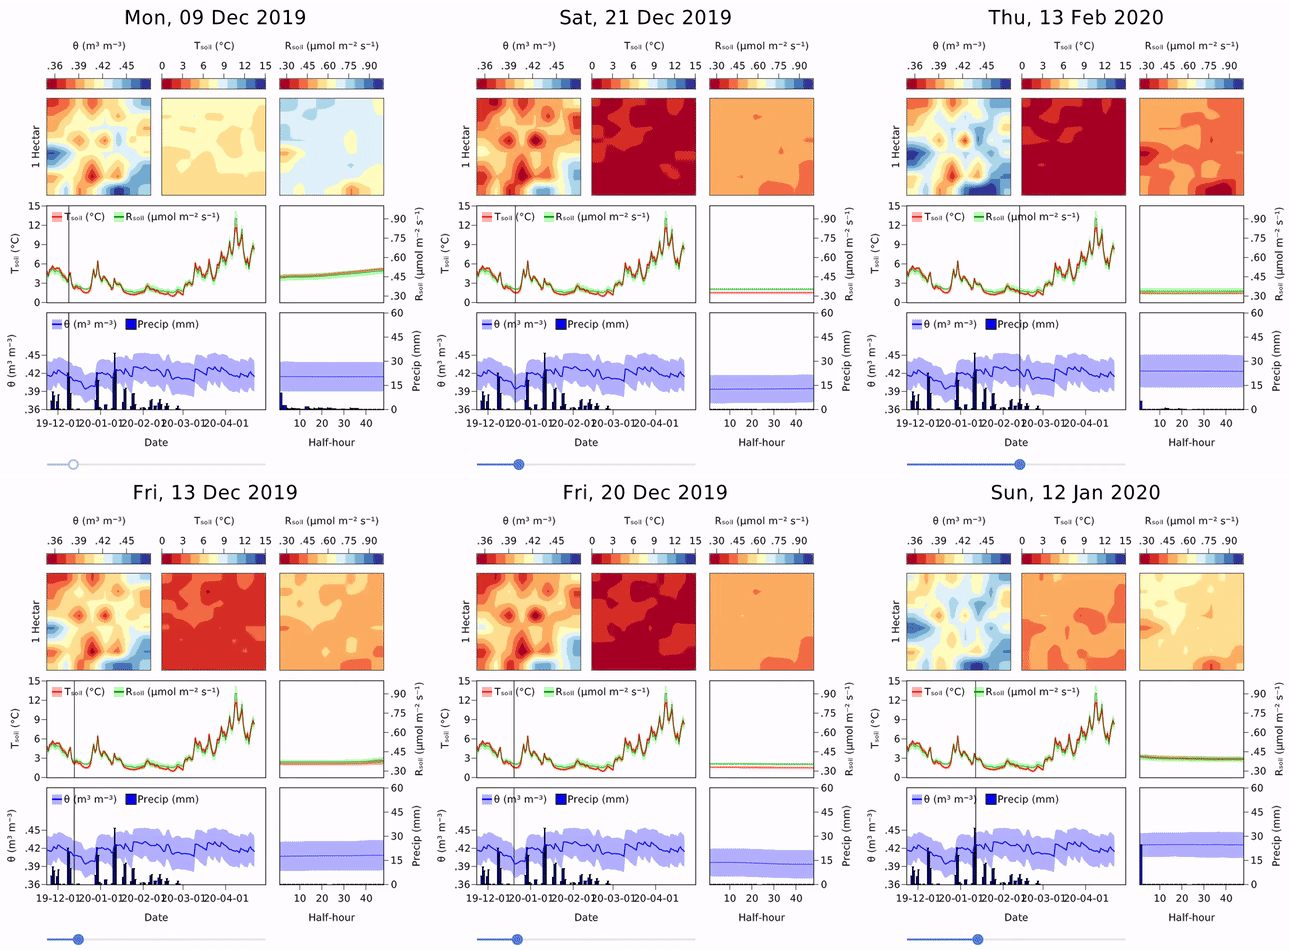 two simple cases:
iteration number slider ->(prediction and error in each iteration)
and the same for each loss function with switcher
two simple cases:
iteration number slider ->(prediction and error in each iteration)
and the same for each loss function with switcher
for time depend pde, time domain slider -> prediction at time step